Public experimental datasets and published machine learning models now let researchers rank peptide candidates by predicted stability before committing bench time to full time-course assays. For storage decisions, the working rule is simple: lyophilized powder at −20°C or −80°C serves as the long-term archive, while reconstituted vials at 2 to 8°C function as short-term working stock with a practical window of roughly 28 to 30 days, driven mostly by sterility limits rather than chemical breakdown. Predictive data narrows the field. Controlled assays confirm it.
TL;DR:
- The deep learning model trained on 77,338 stability profiles can rank peptides by stability with an accuracy reflected by an AUC of around 0.81, but it is limited to sequences under 20 residues and tryptic peptides.
- Peptide storage typically involves lyophilized powder at −20°C or −80°C for long-term use, with reconstituted samples remaining stable for about 28 to 30 days at 2 to 8°C, mostly limited by sterility.
- Generating reliable stability data requires careful assay design, including internal standards, matrix-specific testing, and minimizing adsorption artifacts, especially for hydrophobic or cationic sequences.
- Predictive models help filter candidates before laboratory testing but do not replace direct assays, especially for peptides with modifications like cyclization or unusual amino acids.
- Literature reports on stability often lack standardized metadata, making data comparison difficult; adopting uniform reporting practices and depositing raw data would improve reproducibility and model training.
Table of Contents
- Where To Find Peptide Stability Data Today
- Experimental Methods For Measuring Peptide Stability
- Predictive Models And Web Tools For Screening Stability
- Storage And Handling: What The Stability Windows Really Look Like
- Reading Stability Results: Metrics And Reporting Standards
- A Lab Checklist For Generating Defensible Stability Data
- Verifying Materials Before You Trust Any Stability Number
- What The Data Actually Teaches Us About Stability Reporting
- How USAPeptide.info Supports Your Stability Workflow
- Sources
Where To Find Peptide Stability Data Today
Researchers hunting for usable peptide stability data have more to work with than they might expect, but the resources are scattered across a handful of specialized sources rather than consolidated in one repository.
The largest and most directly useful resource comes from a 2023 analytical chemistry study that built a deep learning model on 77,338 experimental stability profiles, with another 13,649 profiles held out for independent testing. The dataset covers proteotypic tryptic peptides used in proteomics quantification work, and the authors made both the raw stability data and a prediction web server publicly available through a resource hosted at peptidestability.crg.eu. The catch: the web server only accepts sequences under 20 residues, and it was trained specifically on tryptic peptide behavior, so extrapolating its outputs to synthetic or cyclic research peptides like BPC-157 requires caution.
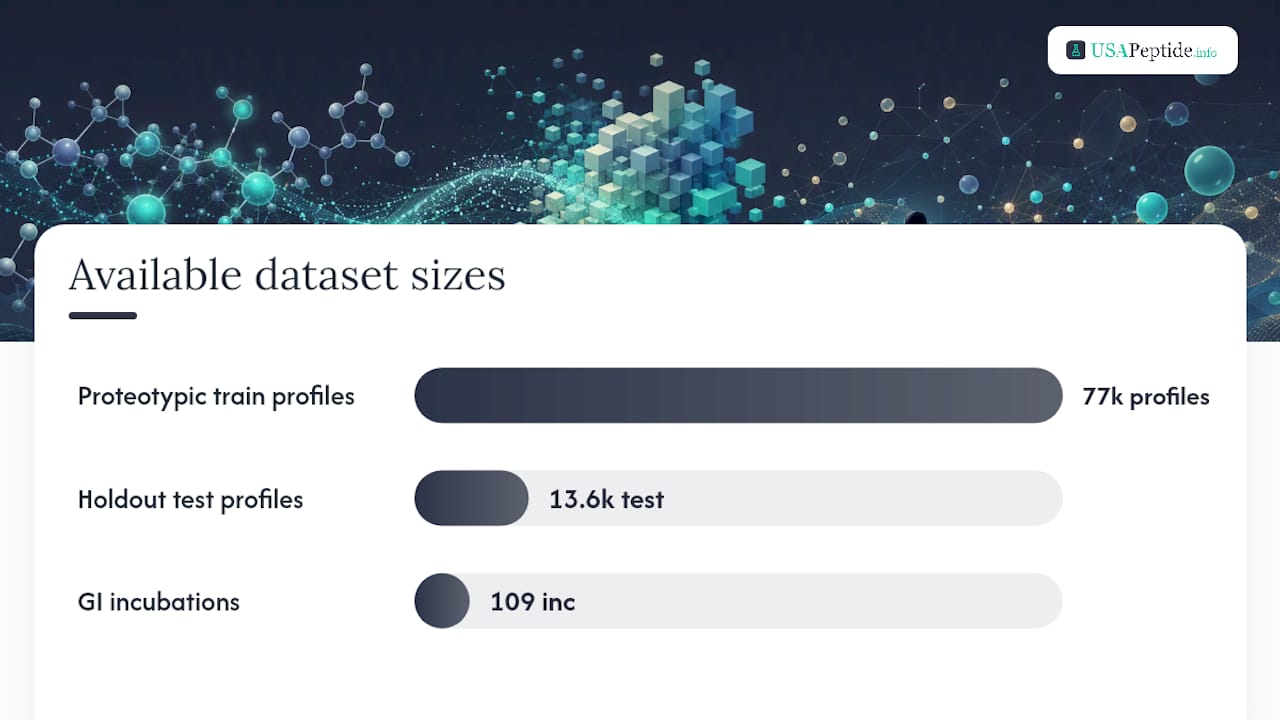
A second major resource focuses on gastrointestinal stability rather than plasma or serum behavior. That IJPharm dataset pulled together 109 literature-reported incubations in simulated gastric fluid (SGF) and simulated intestinal fluid (SIF), then used the results to train classifiers predicting whether a given peptide survives GI transit. The sample size is modest by machine learning standards, but it is one of the only structured collections addressing oral peptide delivery stability specifically, and it comes with published feature-importance data that flags which physicochemical properties matter most.
Beyond these two anchor datasets, researchers will find:
- Supporting information files attached to peer-reviewed stability studies, often containing raw stability profiles, ST1/ST2-style summary tables, and timepoint data not shown in the main text.
- Community-curated compilations maintained by academic proteomics groups, though update frequency and metadata completeness vary widely.
- Manufacturer-published stability summaries, which are useful for orientation but rarely include raw chromatograms or full incubation logs.
- Review articles that aggregate degradation trends across peptide classes without providing a downloadable dataset, useful for context but not for retraining a model.
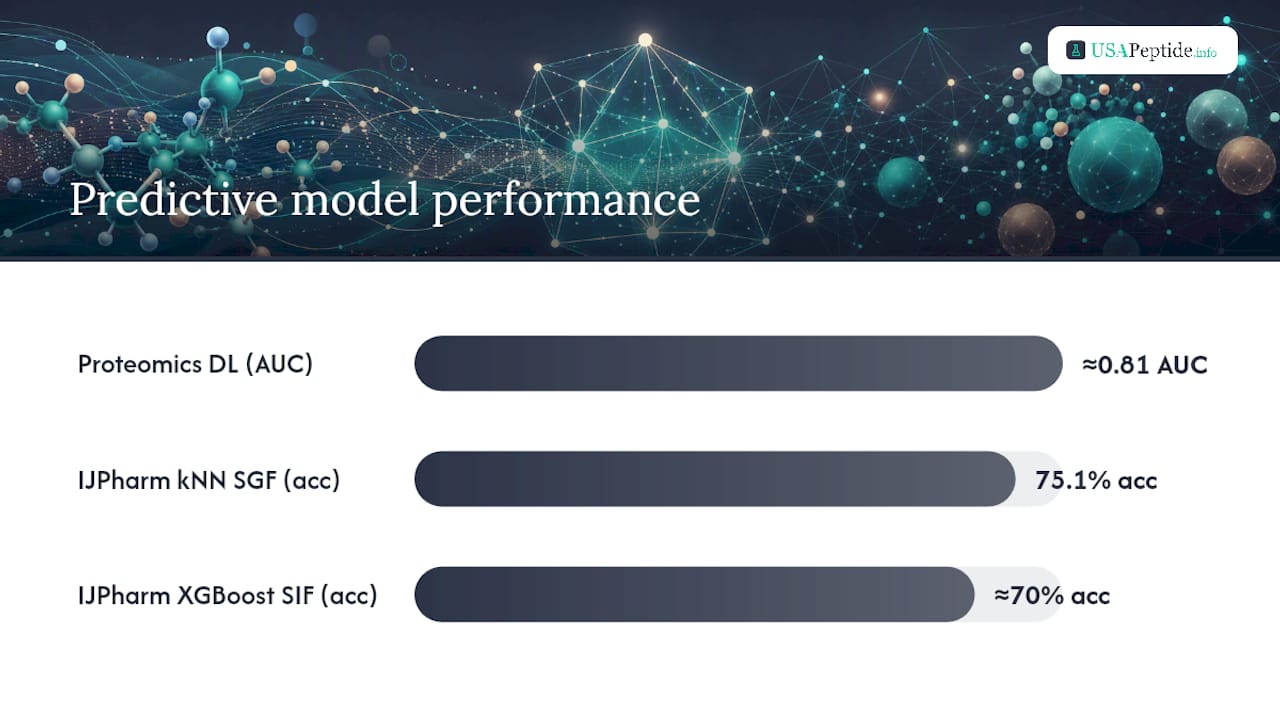
Quick fact: The proteotypic-peptide model behind the ACS paper reports an AUC around 0.81 on holdout data, meaning it correctly ranks stable versus unstable peptides substantially better than chance, though it is not a substitute for a direct assay on your specific candidate.
The recurring problem across nearly every source is inconsistency in how stability gets reported. One paper logs percent remaining at 0, 2, 4, and 24 hours; another reports only a single 48 hour endpoint. Some groups publish full LC–MS chromatograms as supporting information; most do not. If you are trying to build a training set from literature data, expect to spend more time normalizing formats than analyzing results. That reporting gap is exactly why standardized metadata templates matter, a point worth returning to later in this piece.
Experimental Methods For Measuring Peptide Stability
Generating your own peptide stability data reliably comes down to assay design choices that seem minor but compound into major result discrepancies if you get them wrong.
LC–MS/MS time-course analysis remains the backbone method. You spike a known peptide concentration into your matrix of choice, pull aliquots at defined timepoints, quench degradation (usually with acid or organic solvent), and quantify remaining intact peptide against a stable isotope-labeled internal standard. The internal standard matters more than most protocols acknowledge. Without it, instrument drift across a multi-hour run can look identical to genuine degradation, and you will report a false decay curve.
Matrix selection changes the answer. A peptide can look rock-solid in phosphate-buffered saline and fall apart within 30 minutes in simulated gastric fluid, because pepsin and low pH attack different bonds than plasma esterases do. The IJPharm dataset found SIF experiments reported more instability overall than SGF experiments, a pattern tied to enzyme complement and pH-driven hydrolysis differences between the two fluids. Do not generalize GI stability results from testing only one matrix; SGF and SIF are not interchangeable proxies for each other, and a peptide's ranking in one can flip in the other.
Accelerated stability testing speeds up long-term shelf-life estimates by storing samples at elevated temperatures (commonly 40 to 60°C) and applying Arrhenius extrapolation to predict degradation rates at standard storage temperatures. It is a useful shortcut, but it assumes a single dominant degradation mechanism with consistent kinetics across the temperature range tested. When a peptide degrades through two competing pathways, such as oxidation at moderate heat and aggregation at higher heat, Arrhenius extrapolation can produce a misleading shelf-life estimate that looks precise but is not.
A defensible stability run typically includes:
- At least triplicate samples per timepoint, not single measurements presented as data points.
- Continuous temperature logging for every storage condition, not spot checks.
- A documented Certificate of Analysis check on starting material purity before the clock starts.
- Raw chromatogram retention alongside processed peak-area tables.
- A defined quench protocol applied identically across all timepoints.
Pro Tip: Run a zero-time (T0) sample through your full extraction and quench workflow, not just through the LC–MS injection. A surprising amount of apparent "degradation" in early timepoints turns out to be extraction inefficiency masquerading as chemical instability.
The most common failure mode is peptide adsorption to plastic labware, particularly for hydrophobic or cationic sequences, which silently reduces recovered concentration and gets misread as degradation. Using low-binding tubes and including a carrier protein or surfactant in dilute standards heads this off before it corrupts a dataset.
Predictive Models And Web Tools For Screening Stability
Computational stability screening exists to save bench time, not replace the bench. Two published model families dominate the current landscape, and both are useful for the same reason: they let you rank a batch of candidate sequences before spending reagents on all of them.
The proteomics-focused deep learning model trained on tryptic peptide stability profiles reports an AUC of approximately 0.81 predicting stability from sequence alone, no structural or formulation data required. Its web server accepts sequences under 20 residues and was not trained on post-translationally modified or cyclic peptides, so it is a poor fit for evaluating a lipidated or stapled research compound.
For oral and GI-focused work, the IJPharm models take a different approach:
- A k-nearest-neighbors classifier for SGF stability reached 75.1% accuracy with an f1 score of 84.5% under 5-fold cross-validation.
- An XGBoost classifier for SIF stability reached around 70% accuracy with a moderate f1 score, reflecting the harder prediction problem SIF poses.
- Feature analysis across both models pointed to molecular weight, topological polar surface area (TPSA), and lipophilicity as the strongest predictors, with stable peptides in the dataset skewing toward lower molecular weight and moderate TPSA values.
That feature pattern is worth internalizing even without running the model yourself: a smaller, less polar peptide is, on average, a better GI stability bet than a larger, highly polar one, though plenty of exceptions exist.
The practical workflow researchers should follow is straightforward. Feed a candidate list through the relevant predictive tool, drop the clear low-probability performers, and reserve LC–MS time-course or matrix-incubation assays for the sequences that score well. Predictive screening is a first-pass filter that reduces experimental load; it is not a final answer, and both model teams behind these tools frame their predictions as decision-support rather than a replacement for direct measurement. Neither model generalizes well to sequences bearing post-translational modifications, non-natural amino acids, or unusual cyclization, categories that cover a large share of modern research peptides.
Storage And Handling: What The Stability Windows Really Look Like
Storage form determines the timeline more than almost any other variable in a peptide's practical shelf life.
Lyophilized peptide, kept properly desiccated and shielded from light, is your long-term archive format. Reconstituted peptide is your working stock, and it should be treated as a consumable with a countdown clock, not a durable supply.
| Storage form | Temperature | Typical stability window | Key caveat |
|---|---|---|---|
| Lyophilized powder | −20°C | 2 to 5 years | Requires desiccation, protection from light and moisture |
| Lyophilized powder | −80°C | 5+ years | Best for long-term reference stocks |
| Reconstituted (bacteriostatic water) | 2 to 8°C (refrigerated) | About 28 to 30 days | Practical limit is sterility, not necessarily chemistry |
| Reconstituted, aliquoted | −20°C (frozen) | Weeks to months, freeze-thaw dependent | Minimize freeze-thaw cycles per aliquot |
That 28 to 30 day figure for reconstituted vials gets repeated so often it sounds like a chemical constant. It is not. Community lab testing and recent stability analyses indicate the peptide molecule itself can often remain chemically intact well past 30 days under controlled refrigeration. The limiting factor is usually the bacteriostatic water's preservative (typically benzyl alcohol) losing effectiveness and the accumulated microbial risk from repeated vial punctures, not the peptide backbone falling apart on a fixed schedule. Treat the 30-day window as a sterility deadline for shared or repeatedly-accessed vials, and recognize that single-use aliquots frozen immediately after reconstitution can outlast it chemically, even though caution around microbial contamination should still apply.
Practical handling rules that actually move the needle:
- Aliquot immediately after reconstitution into single-use volumes rather than drawing repeatedly from one vial.
- Limit freeze-thaw cycles on any given aliquot to one wherever possible; each cycle risks aggregation for sequences prone to it.
- Use amber vials or foil wrapping for light-sensitive sequences, and minimize headspace air where oxidation-prone residues (methionine, cysteine, tryptophan) are present.
- During shipping, dry ice or gel-pack cold chain excursions of a few hours at ambient temperature are generally tolerated for lyophilized material, but reconstituted samples should never ride outside refrigeration for extended transit.
Detailed temperature-specific handling guidance, including freeze-thaw thresholds by peptide class, is covered in USAPeptide's storage temperature reference.
Reading Stability Results: Metrics And Reporting Standards
Interpreting a stability dataset correctly means knowing which number actually answers your question, since "percent remaining at 24 hours" and "t90" answer different ones.
Percent remaining is the simplest metric: intact peptide concentration at a timepoint divided by the starting concentration. The degradation rate constant (k) comes from fitting a kinetic model, usually first-order, to the concentration-time curve, and it is the number you need for Arrhenius extrapolation. Area-under-the-curve (AUC) measures, borrowed from pharmacokinetics, capture cumulative exposure over a study window and are useful when comparing formulations rather than raw degradation speed.
Minimum reporting practice should include replicate count (triplicate minimum), standard deviation or confidence intervals at each timepoint, and for any model-based prediction, the cross-validation scheme used to generate reported accuracy or f1 figures. A single accuracy number without a validation method attached is close to meaningless.
Arrhenius extrapolation deserves a specific caution here beyond what accelerated testing already flagged: it assumes one dominant degradation pathway across the temperature range studied. If oxidation dominates at 25°C but aggregation takes over at 50°C, extrapolating from high-temperature data back to refrigerated storage will misestimate real-world shelf life, sometimes substantially.
A reporting checklist worth adopting for any internal or published stability study:
- Raw LC–MS files or chromatograms, not just processed peak tables.
- Full incubation logs, including temperature records and matrix source/lot.
- Certificate of Analysis for the starting peptide batch.
- Model code, hyperparameters, or at minimum the algorithm and validation scheme, if predictive scoring was used.
- Explicit statement of replicate number and statistical method applied.
Standardizing these fields across the field would meaningfully increase how much published stability data can actually be reused rather than re-generated from scratch.
A Lab Checklist For Generating Defensible Stability Data
Before the first timepoint is drawn, verify the material. Pull the Certificate of Analysis for the peptide batch, confirm HPLC purity and mass spec identity match spec, and flag any residual solvent concerns, particularly for synthesized peptides where solvent carryover can distort early degradation readings by interfering with detection.
From there, a workable stability experiment plan follows six steps:
- Define the matrix and temperature conditions that match your actual research question, not a generic default.
- Set a timepoint schedule with denser sampling early (0, 1, 2, 4, 8 hours) where degradation is fastest, tapering to daily or weekly checks later.
- Quench each aliquot identically, immediately upon collection, using the same acid or solvent ratio every time.
- Store quenched aliquots at −80°C until batch analysis, so you are not analyzing samples across a drifting instrument baseline.
- Run every sample against a stable isotope-labeled internal standard curve for quantification.
- Analyze all timepoints from a single experiment in one LC–MS batch run wherever instrument time allows.
Include a positive control (a peptide with known, published stability behavior) and a matrix blank in every run. Both catch systematic errors that a single-condition experiment would miss entirely.
Pro Tip: If recovery numbers look erratic between replicates, check adsorption before you blame degradation. Hydrophobic and cationic peptides bind to standard polypropylene tubes at surprisingly high rates, and low-binding tubware alone can resolve what looks like a stability problem but is actually a sample-handling artifact.
Common troubleshooting scenarios include inconsistent recovery (usually adsorption or extraction inefficiency), unexpected early degradation (check for oxidation from dissolved oxygen or trace metal contamination in buffers), and results that don't replicate between operators (usually traced to inconsistent quench timing, which is easy to standardize with a written protocol and a timer, not a stopwatch estimate).
Verifying Materials Before You Trust Any Stability Number
Stability data is only as good as the material it was measured on, which is why material verification belongs at the front of every protocol, not as an afterthought.
USAPeptide's Certificate of Analysis grading tool checks whether a supplier's COA reflects legitimate, complete testing, rather than a boilerplate document reused across batches. The peptide database provides molecular profiles and reference purity benchmarks (≥99% HPLC purity) to check incoming material against before it enters a stability study. For planning aliquot volumes and working-stock concentrations ahead of a freeze-storage schedule, a dosage or aliquot calculator removes the guesswork of matching reconstitution volume to intended experimental use. Independent QC still matters even when a supplier COA looks clean, particularly for any batch feeding a study intended for publication.
What The Data Actually Teaches Us About Stability Reporting
Compiling stability data across multiple published sources surfaces the same problems repeatedly. Metadata gaps top the list: papers report degradation percentages without specifying replicate count, temperature precision, or matrix lot details. Assay descriptions vary enough between labs that a "stable" classification in one dataset and another are not directly comparable, even when both cite the same matrix name.
The fix is not complicated, even if adoption has been slow. Standardized metadata templates, mandatory COA notes attached to any published stability dataset, and routine deposition of raw chromatogram files alongside processed tables would let researchers actually build on each other's work instead of re-running baseline experiments that already exist somewhere in a supplementary PDF. Predictive models improve exactly as fast as the training data feeding them improves, and right now, that data is scattered and inconsistently documented.
— USAPeptide Team
How USAPeptide.info Supports Your Stability Workflow
USAPeptide.info gives you the material-verification layer that stability work depends on, before a single timepoint gets drawn. The Peptriva Research Peptide Resource Center consolidates the database, dosage planning tools, and sourcing guidance in one place, so you are not piecing together spec sheets from five different tabs.

Start with the COA grading tool to confirm a supplier's Certificate of Analysis reflects real ≥99% HPLC purity testing rather than a recycled template, since a stability curve built on unverified starting material is not worth running in the first place. Cross-check the molecular profile against USAPeptide's database entries, then use the dosage calculator to plan aliquot volumes that match your reconstitution and freeze-storage schedule before you open the vial. Visit the Peptriva resource center to line up your material verification and aliquoting plan before your next stability run.
Sources
For primary data and methods behind the figures cited here: the ACS proteotypic-peptide stability model and dataset, the PMC review on stabilization and delivery strategies, the IJPharm GI stability model study, and practical storage guidance from FormBlends and PepPal.
- Assessment and Prediction of Human Proteotypic Peptide Stability for Proteomics Quantification | Analytical Chemistry
- Advancing oral delivery of biologics: Machine learning predicts peptide stability in the gastrointestinal tract
- How to store peptides: Shelf life, fridge vs. freezer & the 30-day myth (2026) | PepPal