
An HPLC chromatogram plots detector response, usually in milli-Absorbance Units (mAU), against retention time in minutes. Before trusting any purity number or peak identity, run three checks: confirm the baseline is flat and stable, match retention time against a known reference standard, and verify the integration settings before accepting the reported area. When the result carries real consequences, treat retention time alone as insufficient and confirm identity with mass spectrometry.
- Baseline: flat, low noise, no drift under the peak of interest
- Retention time: within expected tolerance of a reference standard run under the same method
- Integration: baseline placement and area calculation reviewed, not just accepted from software defaults
Key Takeaways
Trusting an HPLC purity result requires confirming baseline stability, retention time match, resolved peak shape, documented integration settings, and identity confirmation when the result carries real consequences.
| Point | Details |
|---|---|
| Read the axes correctly | Retention time (minutes) shows when a compound eluted; detector response (mAU) shows signal strength, not concentration directly. |
| Favor area over height | Peak area accounts for width and captures the full signal; height alone misrepresents broad versus narrow peaks. |
| Watch tailing and resolution | A tailing factor near 1.0 and resolution above 1.5 are reasonable thresholds before trusting simple integration. |
| Demand integration transparency | Baseline placement, area reject, and slope sensitivity settings all change the reported purity number. |
| Escalate overlap carefully | Move from manual re-integration to BEMG or deconvolution models, and confirm identity with LC-MS when it matters. |
| Verify before you buy | USAPeptide's COA grading tool checks whether a chromatogram trace, integration method, and identity confirmation are actually documented. |
Table of Contents
- What Do the Axes on an HPLC Chromatogram Actually Show?
- Is the Peak Shape Reliable Enough to Trust the Result?
- How Do Integrator Settings Change a Reported Purity Number?
- What Happens When Two Peaks Overlap on the Chromatogram?
- What Does the Research Say About Deconvolution Accuracy?
- What Should You Check Before Accepting a Purity Result?
- Why Transparency in Chromatogram Reporting Matters More Than the Number Itself
- Check a Certificate of Analysis Before You Trust It
- Sources
What Do the Axes on an HPLC Chromatogram Actually Show?
The x-axis tracks elution time in minutes. The y-axis records detector response, most commonly in mAU for UV/Vis detectors, and that signal correlates with how much of a compound is passing through the flow cell at that moment. Retention time identifies when a compound eluted; detector response indicates how much signal it produced, not directly how much compound is present, since different compounds absorb light differently at a given wavelength, as Shimadzu's HPLC primer explains.
Four things to check on a first read:
- Detector wavelength. A peak's height and area depend heavily on the wavelength selected, so two labs running the same sample at different wavelengths can report different numbers without either being wrong.
- Peak height vs. area. Height alone misrepresents a broad peak against a narrow one, which is why area under the peak is the standard metric for quantification.
- Baseline behavior. Drift, humps, or noise under a peak signal a column, mobile phase, or detector issue that can distort both retention time and area.
- Retention time repeatability. A compound's retention time should stay consistent, run to run, against a standard prepared and injected under the same method; a shift of more than a few percent usually points to a column or gradient problem, not a new compound.
Is the Peak Shape Reliable Enough to Trust the Result?
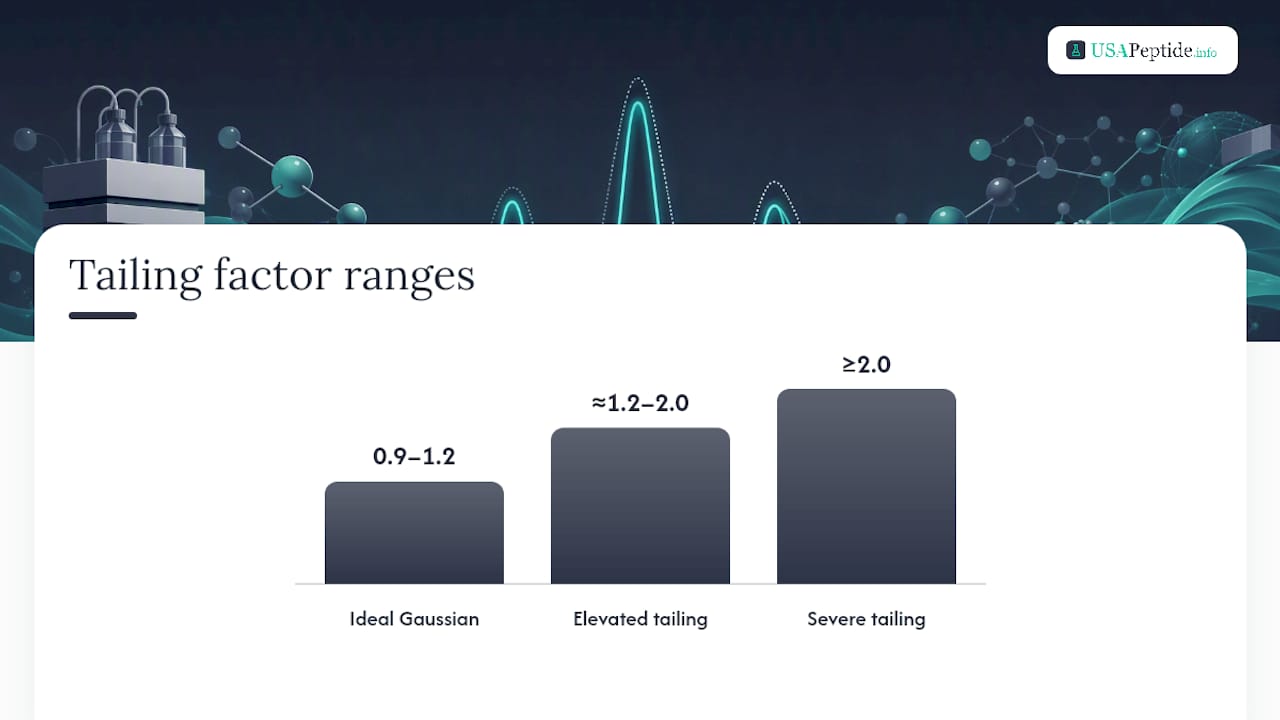
A perfect Gaussian peak is the exception, not the rule, but a peak that strays too far from it usually means the data underneath is compromised. Tailing factor, calculated from peak width at 5% height, should generally sit between 0.9 and 1.2 for a well-behaved peak; values climbing toward 2.0 suggest column degradation, a bad injection, or secondary interactions between the analyte and stationary phase.
Resolution (Rs) between adjacent peaks matters more than most analysts give it credit for. A resolution of 1.5 or higher is the common benchmark for baseline separation, and poor resolution forces the integration software to apportion overlapping signal, which can quietly inflate the apparent purity of a main peak sitting next to an unresolved impurity.
Quick diagnostic checks worth running:
- Compare the peak's actual shape against a modeled Gaussian top to spot fronting or tailing that isn't obvious by eye
- Run a derivative (first or second) across the peak to reveal shoulders hidden inside an apparently single peak
- Watch for asymmetric shoulders on the trailing edge, often the first visible sign of co-elution
A tailing factor near 1.0 with resolution above 1.5 is a reasonable working threshold before trusting a simple area calculation, based on the total peak-shape analysis methods chromatographers use to flag shape problems early.
How Do Integrator Settings Change a Reported Purity Number?
The same raw chromatogram can produce different purity percentages depending entirely on how the integration software is configured. Autointegration algorithms apply defaults, but those defaults are not always right for a given sample matrix, and manual review is often necessary. Settings that change the outcome:
- Baseline placement: where the software decides the peak starts rising from noise
- Peak start/end points: manually adjustable when autointegration misses a shoulder
- Slope sensitivity: how small a signal change triggers peak detection
- Area reject threshold: filters out small peaks below a set area, which can hide real impurities
- Peak width parameter: affects how narrow or broad peaks get flagged during a run
Pro Tip: Ask for the integration method alongside any reported purity number. A COA that shows only a final percentage, with no record of baseline or reject settings, gives you no way to judge whether a shoulder was folded into the main peak or excluded from it.
Area-percent purity is a ratio: the main peak's area divided by the total area of all detected peaks, multiplied by 100. That figure is not the same as assay, which measures absolute content against a calibrated reference, and purity by area-percent does not equal mass percent or confirm identity on its own. A defensible quantification workflow runs a multi-point calibration curve, uses an internal standard where matrix effects are a concern, confirms detector linearity across the expected concentration range, and documents every integration rule applied before the report is issued.
What Happens When Two Peaks Overlap on the Chromatogram?
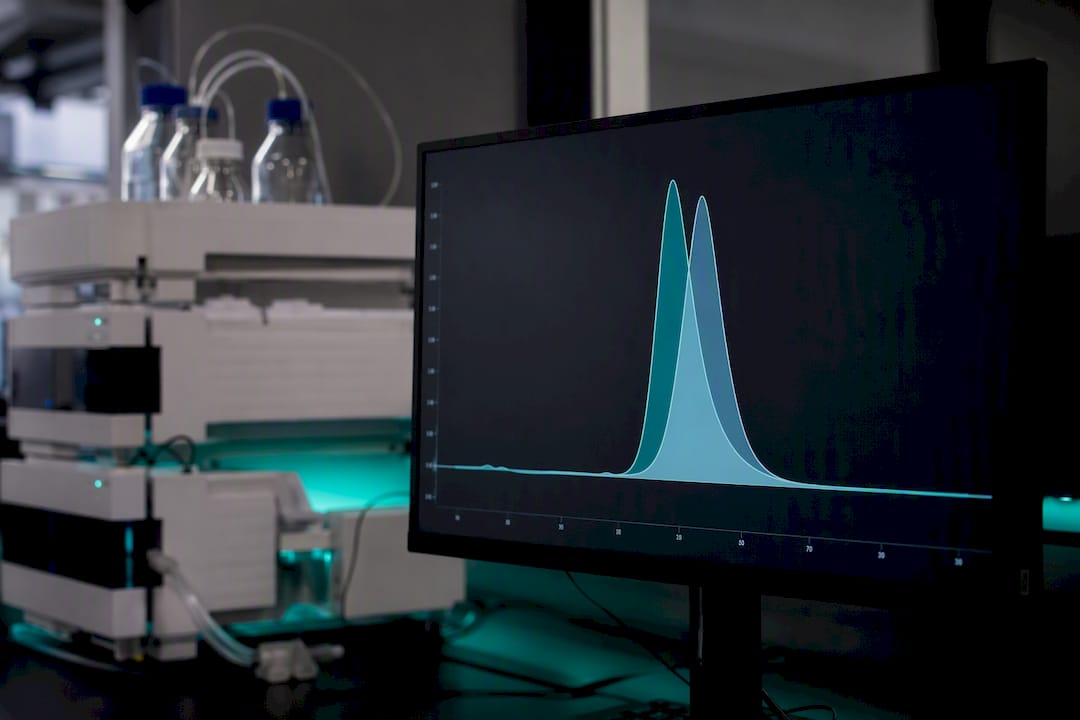
Overlap rarely announces itself clearly. Watch for a shoulder on one side of a peak, an area that shifts noticeably when you switch detection wavelength, or a resolution value under 1.0 between adjacent retention times. Any of those is reason to stop trusting a simple valley-to-valley split.
Valley-to-valley integration, where the software just drops a vertical line at the lowest point between two peaks, works fine when resolution is strong but breaks down fast as peaks move closer together. Model-based fitting, using Gaussian, skewed Gaussian, or bidirectional exponentially modified Gaussian (BEMG) functions, estimates each peak's true contribution mathematically rather than splitting visually.
Peer-reviewed work on BEMG-based fitting, the approach behind the PeakClimber tool, found that model fitting substantially improves quantification accuracy for overlapping peaks compared with simple valley-to-valley splitting, particularly as peaks sit closer together and visual separation becomes unreliable.
Escalation path when overlap is confirmed:
- Re-integrate manually first, adjusting start/end points and reviewing the result against a chromatogram overlay from a clean standard
- Apply peak-fitting software (Gaussian or BEMG models) when manual re-integration still leaves ambiguity
- Move to multivariate deconvolution tools for complex, multi-component overlaps across a full dataset
- Confirm with LC-MS whenever the peaks in question affect an identity claim, not just a quantity claim
What Does the Research Say About Deconvolution Accuracy?
The PeakClimber study found that BEMG-based fitting and constrained multivariate deconvolution meaningfully outperform basic valley-to-valley integration once peaks sit close together. The improved MOCCA implementation automates baseline correction, peak picking, and deconvolution for HPLC-DAD data, and its automated pipeline reduces both runtime and operator-introduced bias for high-throughput reaction screening.
- Model-based fitting narrows the accuracy gap versus manual integration, but that gap widens again as interpeak distance shrinks further
- No deconvolution method fully substitutes for chromatographic separation; a poorly designed method still produces unreliable numbers no matter how sophisticated the math applied afterward
- Labs validating a deconvolution approach should benchmark it against known mixtures at varying resolution before trusting it on unknowns
- When a deconvoluted result affects an identity claim rather than just a quantity estimate, confirm with mass spectrometry rather than relying on peak-shape modeling alone
What Should You Check Before Accepting a Purity Result?
Run through this list before signing off on any chromatogram or Certificate of Analysis:
- Confirm the chromatogram image itself is included, not just a summary number.
- Check retention time against a reference standard run on the same method.
- Review system suitability metrics: resolution, theoretical plates, and tailing factor.
- Ask what integration rules were applied, including baseline and area reject settings.
- Confirm the detection wavelength used, since it directly affects reported area.
- Look for calibration details if an assay value, not just area-percent purity, is claimed.
- Determine whether identity was confirmed independently, typically by LC-MS.
A complete purity report includes the chromatogram trace, column and gradient summary, detection wavelength, and integration method, not just a final percentage. If any of those items is missing, request it directly from the provider before treating the number as settled.
Why Transparency in Chromatogram Reporting Matters More Than the Number Itself
We look at the chromatogram before the percentage. A purity figure without the trace, the method, and confirmed identity tells you very little, and we built USAPeptide's COA grading tool around that principle to catch omissions researchers might otherwise miss.
— USAPeptide Team
Check a Certificate of Analysis Before You Trust It
USAPeptide.info gives researchers a direct way to check whether a Certificate of Analysis holds up, without waiting on a third-party lab to review it manually. The COA grading tool scores whether a chromatogram trace, integration method, and identity confirmation are actually present, rather than just a purity percentage on its own.

Beyond the grading tool, the peptide research glossary defines terms like tailing factor and resolution referenced throughout a COA, useful when a report uses shorthand a lab tech might not immediately recognize. Category pages, including the guide to peptides used in tissue recovery research, show real chromatogram examples alongside the compounds researchers are sourcing. Run your next Certificate of Analysis through the COA grading tool before you commit to a supplier.